
1) Low unemployment rate.
The unemployment rate declined to 4.1% in October. The unemployment rate is down from 4.8% in October 2016 (a year ago), and is down from the cycle peak of 10.0% in October 2009.
 Click on graph for larger image.
This is the lowest level for the unemployment rate since December 2000.
Also, this is the largest decline in the unemployment rate, from cycle peak-to-trough, since the BLS started tracking the unemployment rate in 1948. (In the early '80s, the unemployment rate declined from 10.8% to 5.0%; a decline of 5.8 percentage points. The current decline from 10.0% to 4.1% is 5.9 percentage points!)
2) Low unemployment claims.
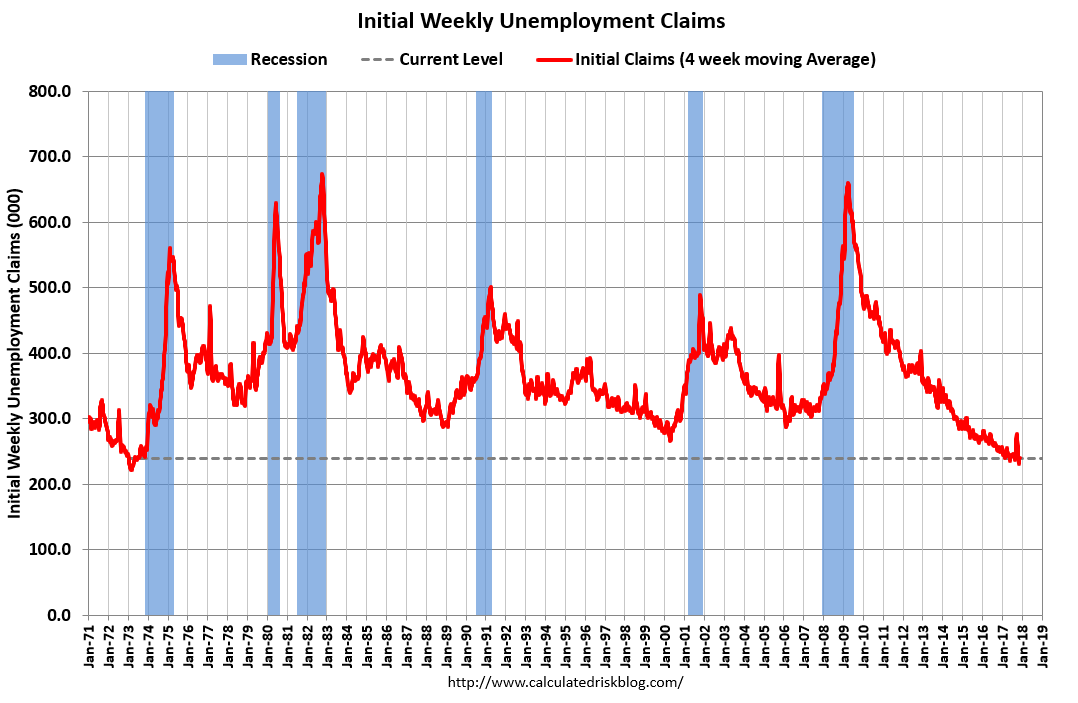 The number of new claims for unemployment insurance benefits is close to the lowest level in 40 years (with a much smaller population back then). The four week average of new unemployment has fallen to 239,750, down from 251,000 a year ago, and down from the peak of 660,000 during the great recession.
Here is a graph of initial weekly unemployment claims.
The dashed line on the graph is the current 4-week average. The four-week average of weekly unemployment claims is at 239,750.
The low level of claims suggests relatively few layoffs.
3) Job Openings Near Record Levels.
There were 6.09 million job openings in September. This is close to the record high of 6.14 million in July 2017.
 This graph shows job openings (yellow line), hires (dark blue), Layoff, Discharges and other (red column), and Quits (light blue column) from the JOLTS.
 Job openings (yellow) have been above 5 million for 33 consecutive months.
Note that Quits are up 4% year-over-year. These are voluntary separations. (see light blue columns at bottom of graph for trend for "quits").
More job openings, and rising quits, are positive signs for the labor market.
4) Household Debt burdens are near record lows.
Household debt burdens have declined sharply over the last several years.
The Household debt service ratio was at 13.2% in 2007, and has fallen to under 10% now.
 The graph, based on data from the Federal Reserve, shows the Total Debt Service Ratio (DSR), and the DSR for mortgages (blue) and consumer debt (yellow).
The overall Debt Service Ratio increased slightly in Q2 2017, and has been moving sideways and is near a record low. Note: The financial obligation ratio (FOR) was unchanged in Q2 and is also near a record low (not shown).
The DSR for mortgages (blue) are near the low for the last 35 years. This ratio increased rapidly during the housing bubble, and continued to increase until 2007. With falling interest rates, and less mortgage debt (mostly due to foreclosures), the mortgage ratio has declined significantly.
This data suggests aggregate household cash flow has improved.
5) New Home Sales are increasing - and will probably increase more.
 The first graph shows New Home Sales vs. recessions since 1963. The dashed line is the current sales rate.
New home sales were at 667 thousand SAAR (Seasonally Adjusted Annual Rate) in September, up from 570 thousand SAAR in September 2016, and up from the cycle low of 270 thousand SAAR in February 2011. This was the highest sales rate since October 2007.
Even with the increase in sales over the last several years, new home sales are still somewhat low historically and will probably increase over the next couple of years.
There are still problems, some people have not participated in the current expansion, wage growth has stalled in 2017 after picking up in 2015 and 2016, wealth and income inequality are at record extremes, and climate change is posing a real threat to the economy in the future - but there are economic reasons to be thankful this Thanksgiving.
Happy Thanksgiving to All!